Models of ocean conditions are numerical predictions of what the ocean is like at a given time, based on inputs and known physics. The inputs are observations from satellites, moorings, tidal gauges, high-frequency radar stations, and buoys, among other sources. This information is collected daily and fed into the model. […]
Approximately 250 eighth grade students from Weddington Middle School (near Charlotte, NC) began their three-day field trip to NC’s Outer Banks with a marine science presentation by OOMG scientists at NC State University’s James B. Hunt, Jr. Library. On March 29, graduate student Laura McGee, Lab Manager Jennifer Warrillow, and […]
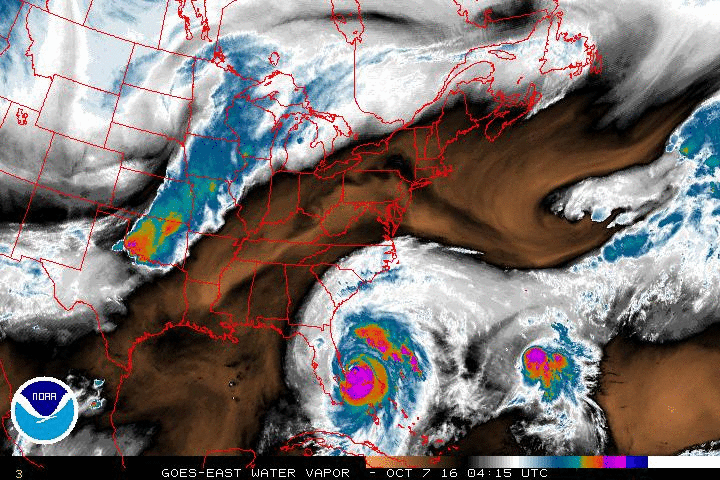
Roy He and Ben Johnson presented a seminar on ocean forecasting with OOMG’s CNAPS model at NCSU’s Hunt Library on October 14, 2016. In the Coffee and Viz seminar series, researchers use the Teaching and Visualization Lab’s 270 degrees of screen to envelop the audience with dynamic images of state-of-the-art […]
The new Coupled Northwest Atlantic Prediction System (CNAPS) web site allows users to interact with the group’s ocean model of past, present, and three-day future ocean states. Expanding the domain of the SABGOM model, CNAPS covers the ocean from Nova Scotia to Venezuela and west in the north Atlantic, and includes […]
An interactive exhibit at the Bush Presidential Library and Museum, located at Texas A&M University, allows visitors to “Make Your Own Oil Spill.” Visitors can “spill” oil in the Gulf of Mexico and South Atlantic Bight by tapping a touch-screen display, then watch the program map the dispersal of the […]
This display animates the NCSU SABGOM model-simulated trajectories of surface floats released within the South Atlantic Bight and the Gulf of Mexico on the day of the Deepwater Horizon oil spill (April 20, 2010) and where they would drift for the following six months. To see the trajectory of a […]